|
Using modern statistical techniques such as Fourier Transforms, trigonometric & Array analysis, Cycle Trends searches for cycles within the data stream of the stock under analysis, establishing its strength and reliability, and then projects the cycle into the future, forecasting tops, bottoms and trend reversals.
Cycle Trends uses three specialized indicators for performing the cycle analysis.
Cycles-Trig or Cycles-Array, Trendic and TrueOBOS.
In the two case studies below, Cycles-Trig has been used.
Brief description of the indicators.
Cycles-Trig
Cycles of a specific shape viz. a sinusoidal shape are fitted into past data via trigonometric regression. The best ones are chosen by the program and then projected into the future zone.
The purpose is to establish the peaks, low points, and the trend of the stock under analysis.
TrueOBOS
Overbought or oversold levels are established by measuring the deviation from the Fourier trend (blue line on the graph) in a very special and statiscally sound way.
The thin red line and green lines are one MAPD (mean absolute percentage deviation) away from the 0-degree line and the thicker lines 2 MAPD's away.
If the indicator is below the green lines a potential buy zone is established and above the red lines a potential sell zone.
Trendic
Trendic is another way of finding cycles, but specifically only harmonic cycles.
Trendic is not a forecaster but a confirming indicator, though traders do use it for buying and selling.
A positive signal is generated when Trendic moves above 0, and negative when it moves downwards through zero.
In broad general terms these three cycle indicators should confirm turning points in the time series, before an investment decision is made.
Case Study #1 - Dow Jones Industrial Average July 22, 2002
Introduction
Stocks tumbled in the United States on Monday July 22, plunging the Dow Jones Industrial Average to levels last seen in 1998. Falls were again triggered by worries over corporate scandals and warnings of poor corporate earnings.
Analysis of the graph below, taken on July 22, indicates a strong buy signal for the Dow, and stocks included in the index.
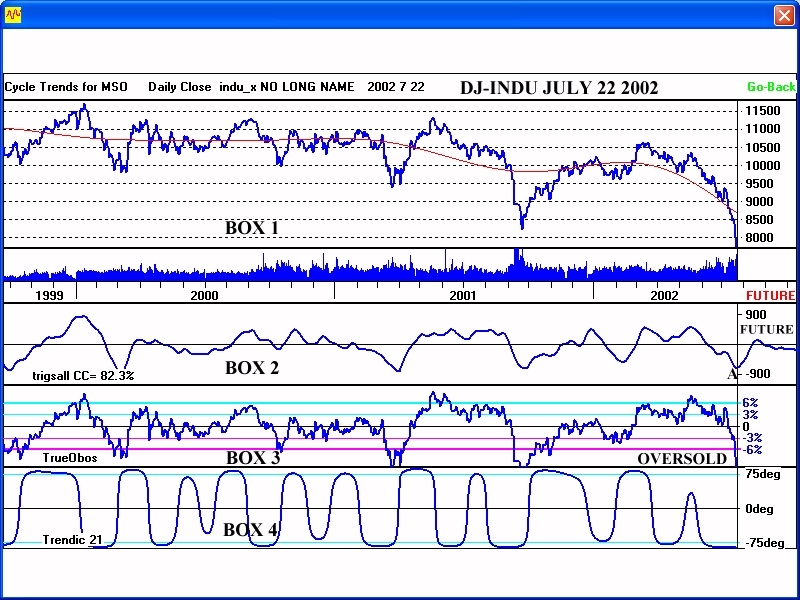
The price graph below is divided into 4 boxes.
Click on thumbnail to view Larger Image
Box 1
The graph in the top box is the price defaulted to a line of daily closing prices.
Underlying this graph is a smooth green line. This is the Fourier line, around which the cycles are filtered and calculated.
The fall of the Dow to 8019 (closing price) is clearly shown.
Box 2 Contains a line graph of the trigonometric cycles. The line is a combination of the 22 cycles that have traced the peaks, lows and trends of past data.
The cycle low is clearly seen at point 'A' with a strong rise projected and forecasted in the future zone for the next month.
Box 3 This box contains TrueOBOS; the overbought/oversold indicator derived from cycle analysis.
The indicator is well below the thick green line, at a severely oversold "buy" level.
Box 4 This box contains the Trendic indicator.
Though the indicator is at -75 degrees, it turned up 2 days later to go past zero to confirm the cycle low and "buy".
Conclusion
Cycles and TrueOBOS point to a cycle bottom with a rise into the future.
Result
The Dow rose from 8019 on July 22, 2002 to reach 9053 on August 23, 2002.
Case Study #2 - City Lodge July 29 Price 1160c
Introduction
Shortly after touching 1295c in May 2002, City Lodge declined to close at 1160c on July 29, 2002.
Based on the cycle graph below, it was clear then that the bear trend was over and that City Lodge was due to recover.
This conclusion was derived from the following chart analysis.
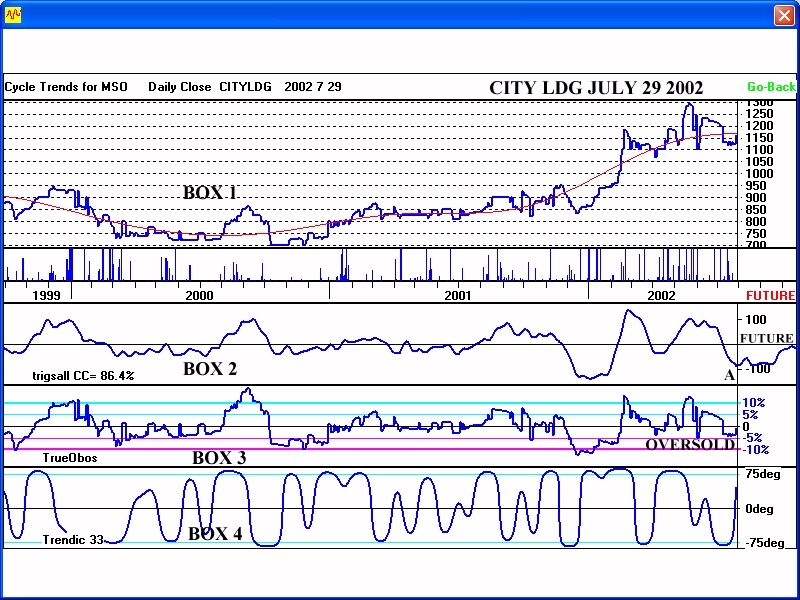
The graph is divided into 4 boxes.
Click on thumbnail to view Larger Image
Box 1
The line graph shows the fall of City Lodge from 1295 on May 22, 2002 to 1135 on July 18.
Box 2
Contains the line graph of the trigonometric cycles.
The line is a combination of 22 of the most accurate cycles.
A cycle low is registered at 'A' completing the most recent fall of the cycle.
The cycle line in the future zone is turning upwards, forecasting that the recent rise of City Lodge from a low of 1125c was set to continue.
Box3
This box contains the TrueOBOS (overbought/oversold) indicator.
The indicator has risen from the light green oversold line, corresponding to the cycle low in Box 1.
Box 4
This box contains the Trendic indicator derived from the incline (slope) of the Fourier trend, seen as the green line in Box 1.
The direction of the trendic line must confirm the direction of the cycles.
It is clear in this graph that the trendic line has turned up through the zero (0) line confirming the change in trend of City Lodge.
Conclusion
All 3 indicators point to City Lodge moving up strongly.
Result
As at August 23, 2002 City Lodge had risen to 1385.
Reasons given were, that earnings would be boosted by tourists for the Summit and World Cup.
|